Air Pollution & Marine Shipping
#sustainableshipping #airpollution #gettingtozero
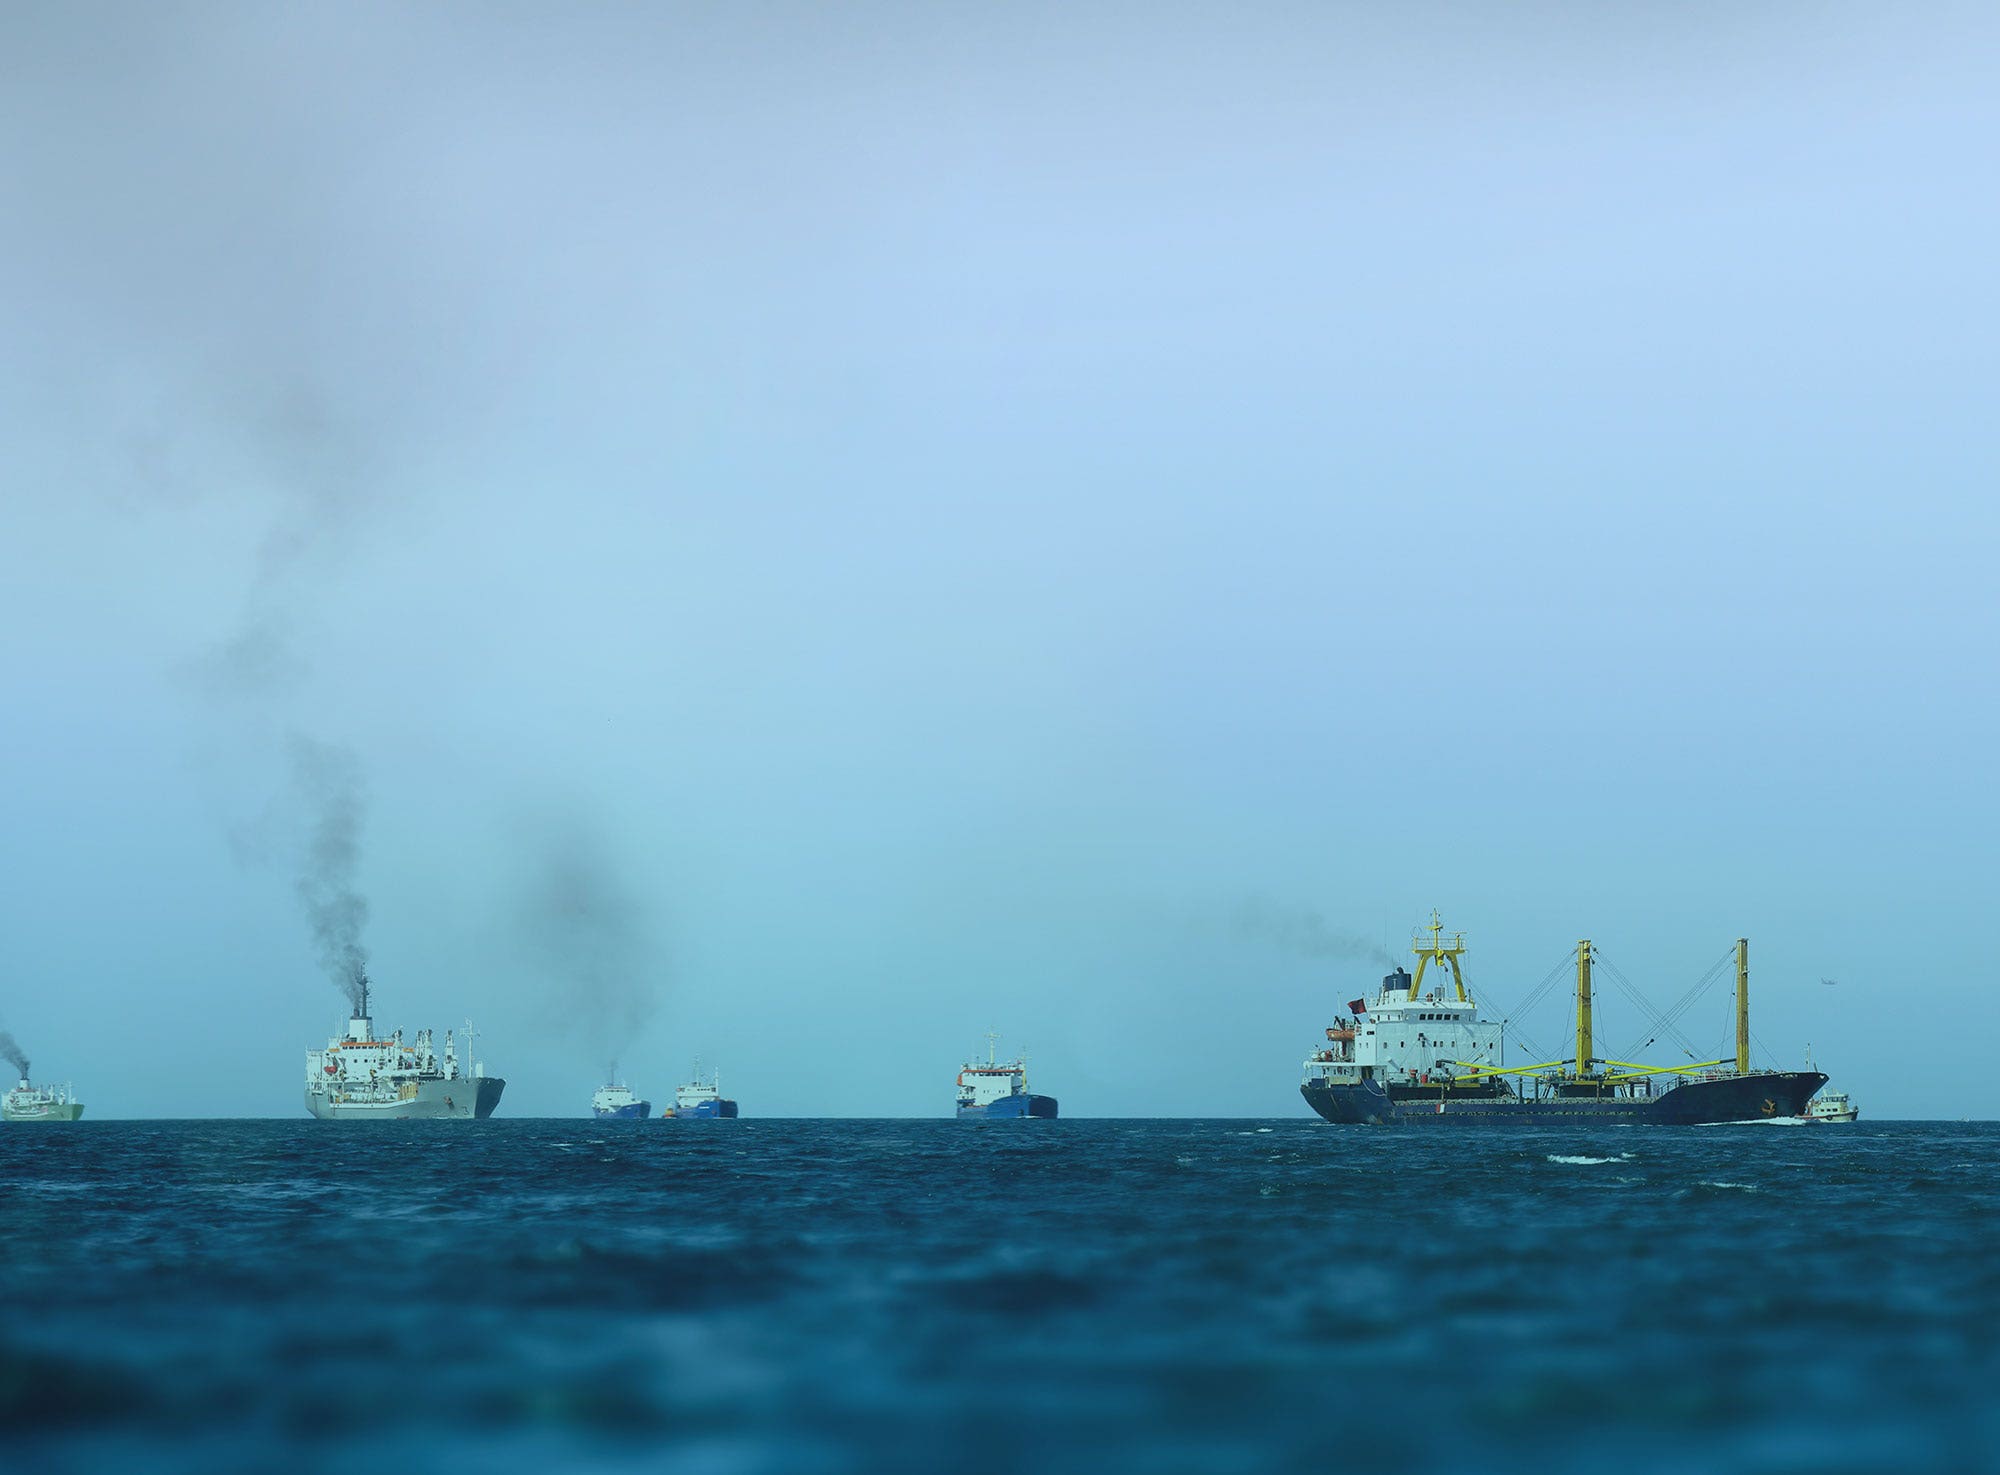
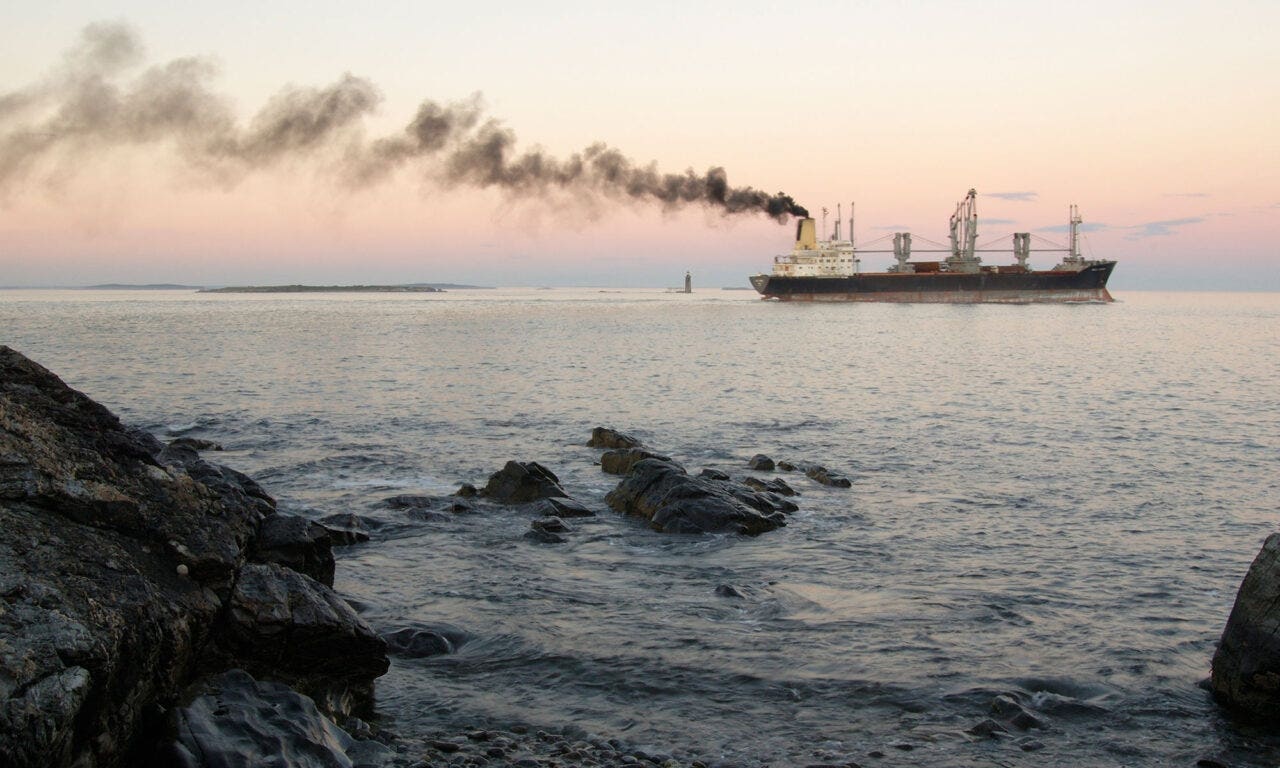
While essential to the world’s economy and well-being, the commercial marine shipping industry is a major contributor to global air pollution and without action, the industry’s emissions are expected to increase.
These emissions can harm human health and our environment.
New regulations and practical initiatives are planned or in force to reduce the amount of air pollution produced by ships.
This site’s purpose is to share objective information about the impacts of air pollution from the marine shipping industry – including the types of air pollution ships emit, how these emissions are harmful, and what’s being done to reduce them – and to encourage informed conversations about these issues.
This site was created by Clear Seas, a Canadian not-for-profit organization that provides independent fact-based information to enable governments, industry, and the public to make informed decisions on marine shipping issues.
Marine Shipping’s Impact on World Air Pollution
Ships move more than 80% of the world’s goods.[1] When compared to other forms of transportation, marine shipping is the most energy-efficient way to move large volumes of cargo.[2]
Like all other forms of transportation that burn hydrocarbon fuels for energy, ships create air pollution that degrades air quality, adversely affects human health and contributes to the wide-reaching effects of climate change.
Energy Efficiency of Transportation Modes
Distance 1 tonne of cargo can travel on 1 litre of fuel in Canada’s Great Lakes and St. Lawrence Seaway.[7]

Transferring cargo from trucks or trains onto ships and barges where possible, called short-sea shipping, can reduce overall transportation emissions.
While responsible for the release of less greenhouse gas (GHG) per tonne-kilometre of cargo transported than other forms of transportation[8], ships contributed approximately 3% of the world’s total GHG emissions in 2018.[9]
In coming years, global shipping traffic is expected to grow in response to increased trade. Unless additional measures to limit emissions from ships are adopted and implemented, GHG emissions from shipping could increase by as much as 90% to 130% of 2008 emissions by 2050, depending on economic conditions.[10]
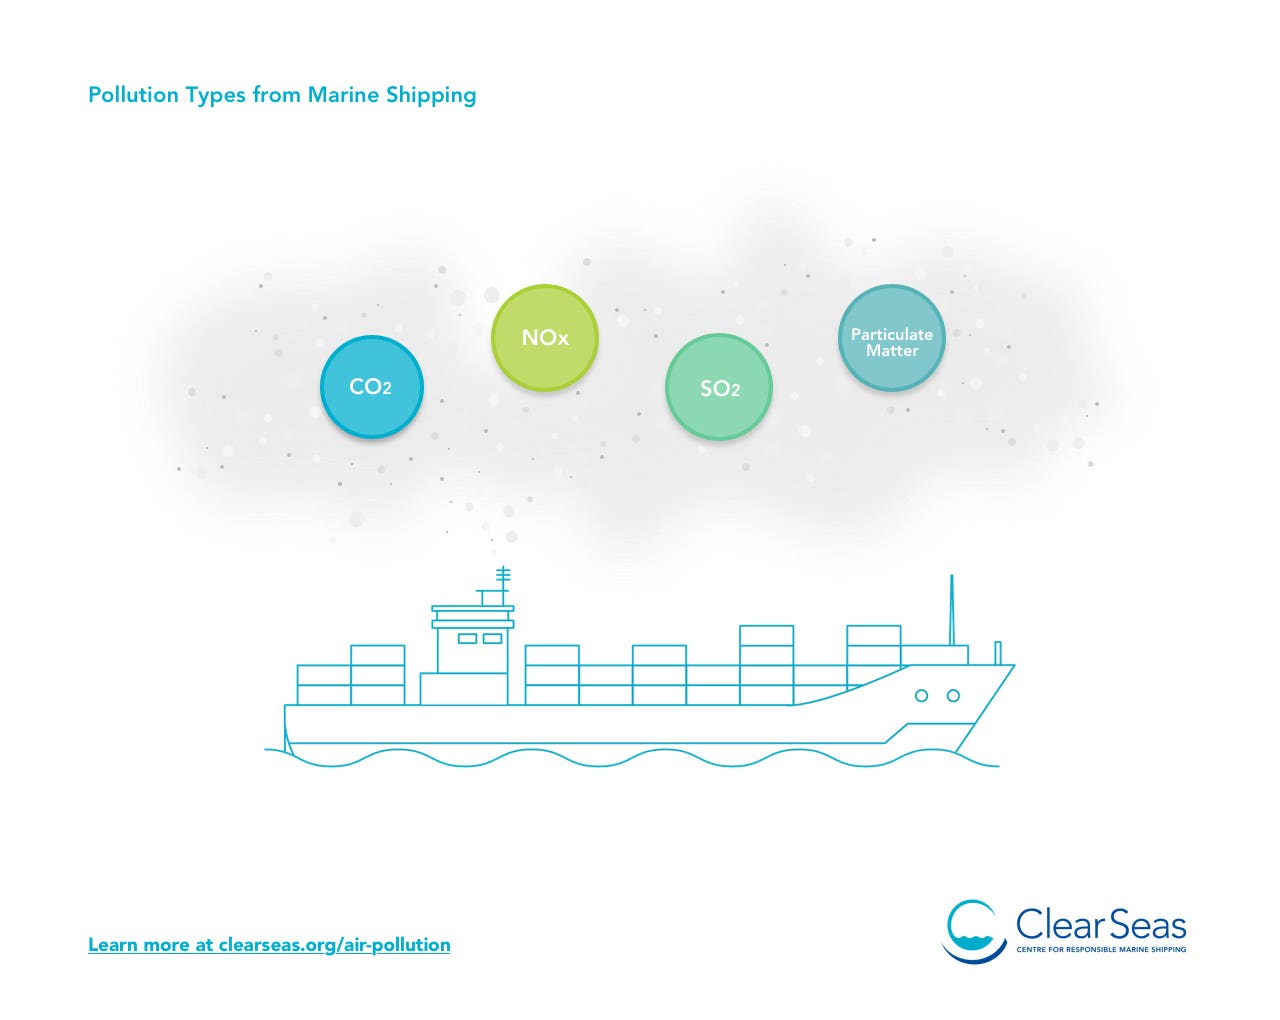
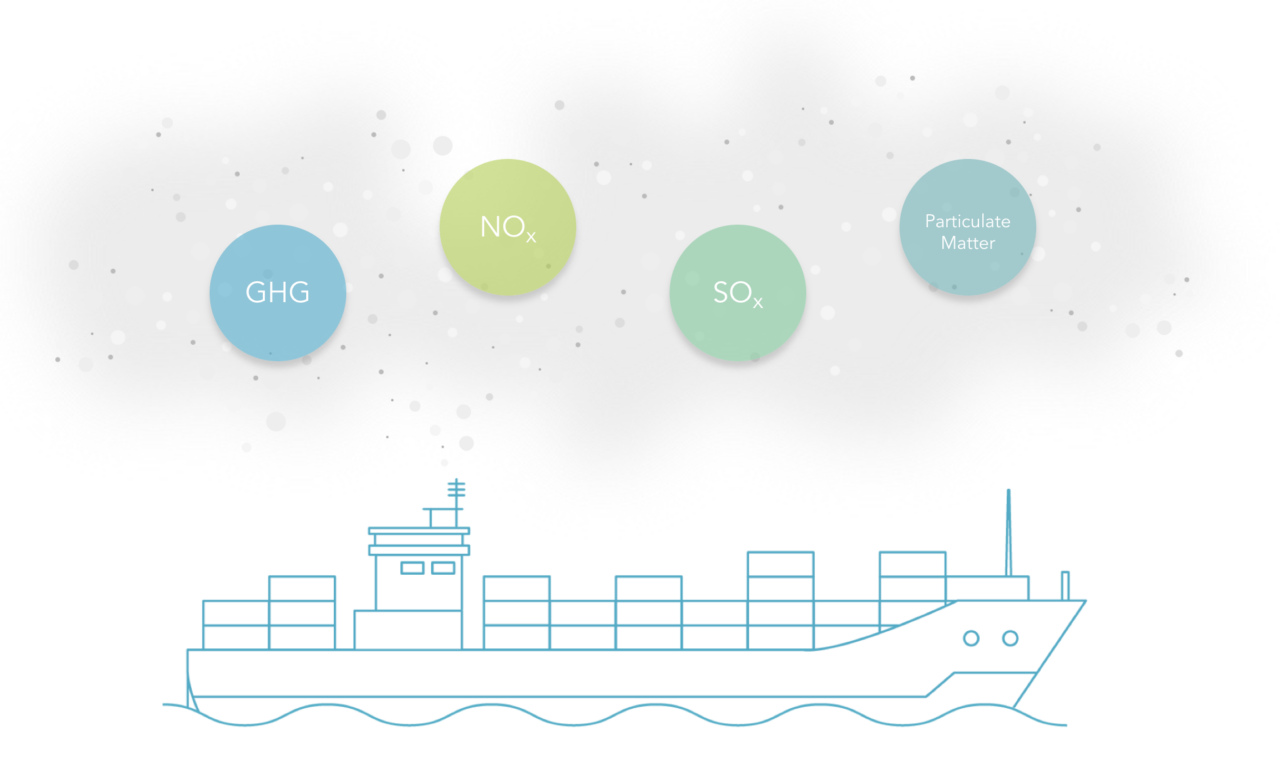
Types of Air Pollution from Marine Shipping
Commercial ships burn fuel for energy and emit several types of air pollution as by-products. Ship-source pollutants most closely linked to climate change and public health impacts greenhouse gases (GHG)[11], nitrogen oxides (NOx), sulphur oxides (SOx) and particulate matter.[12]
On a global scale, the marine shipping industry’s share of total emissions from human sources is:
For context, Canada’s annual contribution from all sources to global CO2 emissions is 1.5%.[14]
Pollution Types from Marine Shipping
Primary GHG emissions include carbon dioxide (CO2), methane (CH4), and nitrous oxide (N2O), which contribute to climate change and ocean acidification.
- GHG contributes to widespread climate change by trapping the sun’s heat. In Canada, these climate changes include increased average and extreme temperatures, shifting rainfall patterns, thawing permafrost, and increases in hazardous weather.[20]
- Climate change-induced extreme weather events such as heat waves, floods and major storms have a negative impact on human health and cause premature deaths worldwide.
- When CO2 is absorbed by seawater, the water becomes more acidic. This increase in acidity has adverse effects on marine life and ecosystems.
A collection of gases of various combinations of nitrogen and oxygen that:
- Cause lung inflammation when breathed, increasing susceptibility to harm from allergens in people with asthma. NOx may enter the bloodstream and with long-term exposure lead to eventual heart and lung failures.[21]
- Interact with volatile organic compounds (VOCs) to create ground-level ozone, which contributes to eye, nose and throat irritations; shortness of breath; worsening of respiratory conditions; chronic obstructive pulmonary disease; asthma and allergies; cardiovascular disease and premature death.[22]
- Cause acidification of soil and water (acid rain).
- Decrease crop and vegetation productivity due to ground-level ozone, threatening food security.
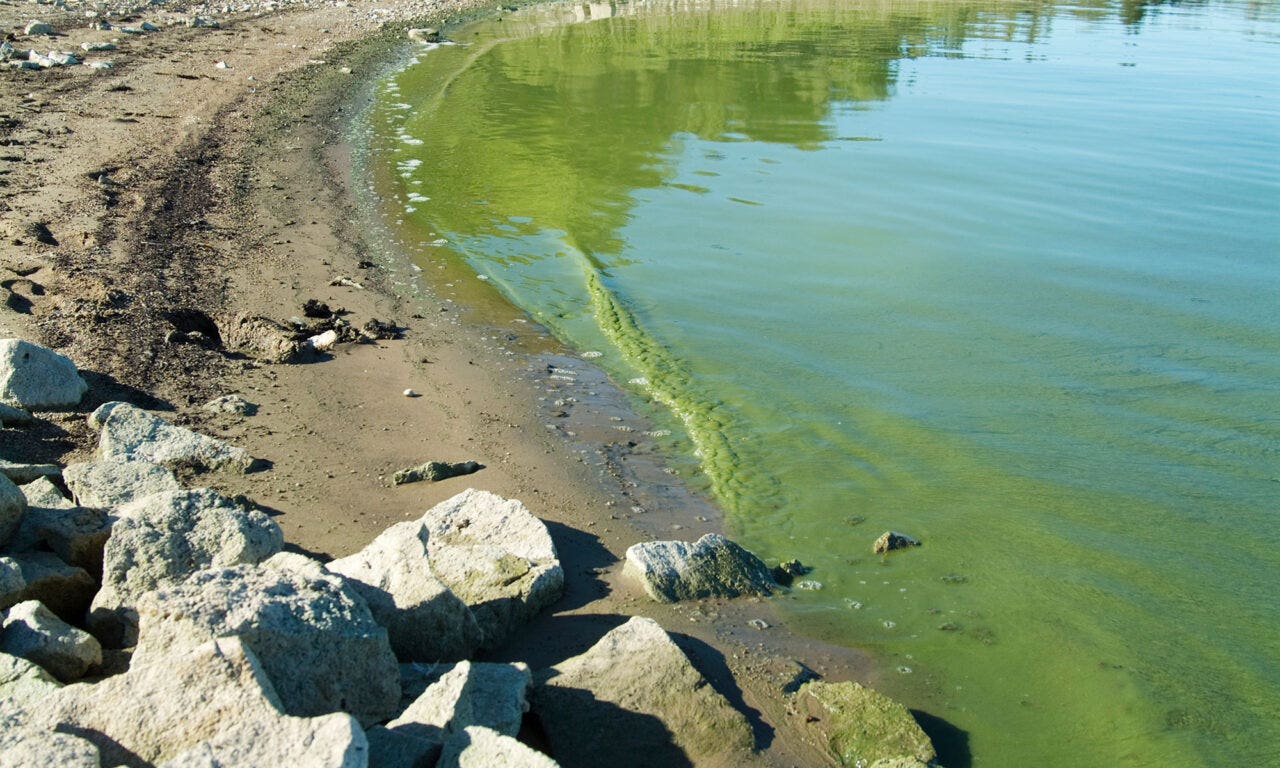
- Flood ecosystems with excess nitrogen nutrients, leading to toxic algal blooms in coastal waters and inland lakes.[23]
A collection of gases of various combinations of sulphur and oxygen that:
- Cause lung inflammation when breathed, increasing susceptibility to allergens in people with asthma. SOx and may enter the bloodstream and with long-term exposure lead to eventual heart and lung failures.[24]
- Cause eye irritation, increased susceptibility to respiratory tract infections, and increased hospital admissions for cardiac disease.[25]
- Cause acidification of soil and water (acid rain).
A collection of solid and liquid particles formed during fuel combustion that:
- Can be inhaled into people’s lungs and then absorbed into the bloodstream, which has been linked to many negative heart and lung health outcomes, including cancers.[26]
- Are a component of smog.[27]
- Form “black carbon”, the second largest contributor to climate change after CO2.[28] While airborne, black carbon absorbs solar energy and contributes to atmospheric warming, before falling to earth as precipitation that darkens snow and ice surfaces.[29] High concentrations of black carbon on ice and snow significantly reduce solar energy reflected back into space – the albedo effect – and accelerate melting.[30]
Impacts of Marine Shipping Air Pollution in Canada
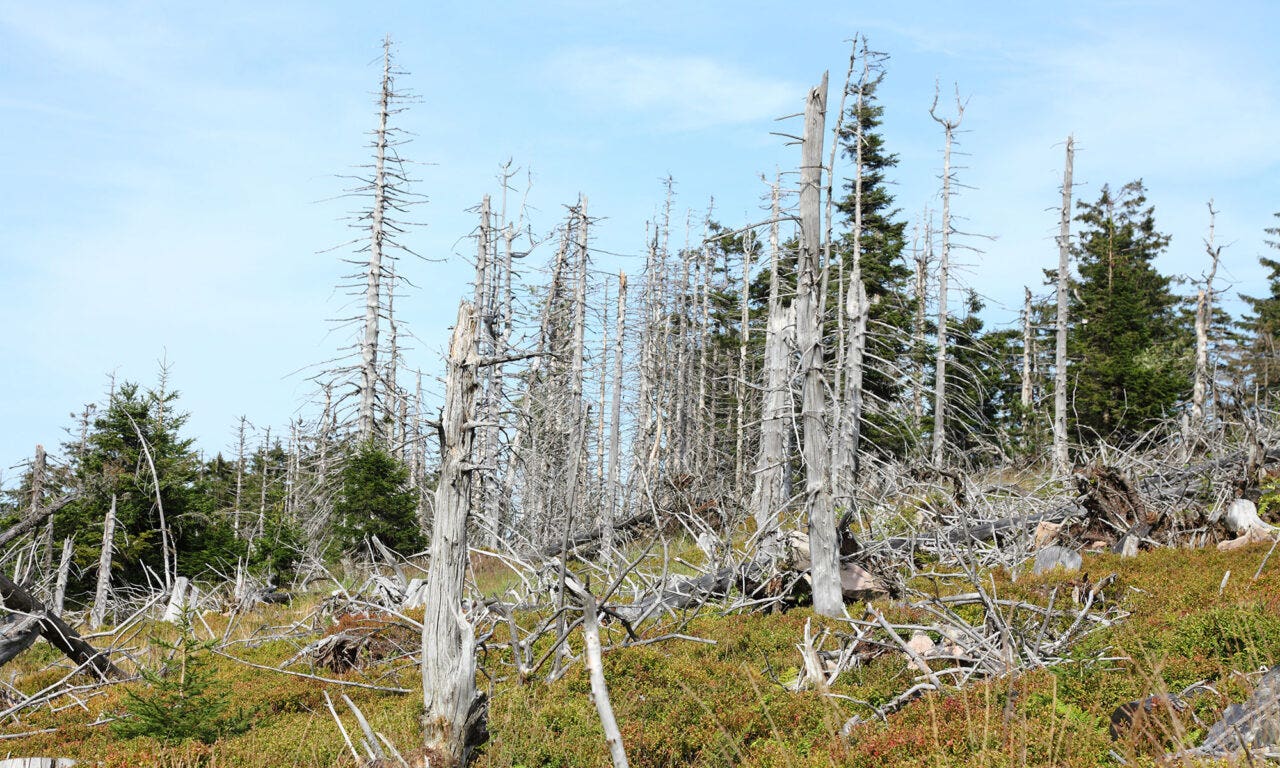
Canadians feel the economic impacts from all sources of air pollution, including lost productivity; increased healthcare costs; decreased quality of life; stunted crops, plants, and trees (as shown above); and discoloured and damaged outdoor structures and materials – all of which costs Canadians and the Canadian economy billions of dollars per year.[31]
The health and environmental impacts of air pollution from marine shipping are also felt in Canada, where marine shipping produced 4.2 million tonnes of GHG emissions in 2020 or about 0.6% of total Canadian GHG emissions.[32]
Impact of Air Pollutants from Marine Shipping in Canada
Click on each pollutant in the legend to reveal its impact on the map
Arctic Impacts
Air pollution from marine shipping both within and outside the Arctic impacts climate change and the health of people and ecosystems in the Arctic,[41] and the number of ships transiting the Arctic, although currently low, is projected to increase.
The most common type of fuel used in the Arctic is marine fuel oil, a non-persistent fuel. However, 10% of ships operating in the Canadian Arctic use heavy fuel oil (HFO) and their consumption of HFO increased by 82% between 2016 and 2019.[42] HFO is also used for land-based activities throughout the Arctic. The combustion of HFO creates particulate matter (including black carbon) that is known to increase the rate of Arctic sea-ice melt.[43]
In April 2018, the IMO committed to reduce the risks associated with HFO. Canada and the Marshall Islands submitted a proposal to assess economic and other impacts on Arctic communities as a result of a ban on HFO use and carriage in the Arctic because Canadian Arctic communities rely on shipping to bring in essential goods including fuel, and rely on HFO as a source of energy on land.[44]
Approved in 2022, the ban on the use and carriage for use by ships of HFO in the Arctic begins in July 2024, although allowed exemptions and waivers[45] mean that a full ban on HFO for ships in the Arctic will not be enforced until 2029.[46]
In the Antarctic, the use and carriage of HFO has been banned since 2011.[47]
Reducing Air Pollution from Marine Shipping
In Canada, air pollution from ships is regulated by the Canada Shipping Act, 2001[48] and the complementary “Vessel Pollution and Dangerous Chemicals Regulations,” which incorporate standards established by the IMO.
The IMO regulates pollution from ships through the International Convention for the Prevention of Pollution from Ships (MARPOL).
In April 2018, the IMO adopted an initial strategy to reduce ship-source GHG, intended to reduce total annual emissions by at least 50% (compared to 2008 levels) by 2050.[51] This strategy was revised in July 2023 to commit the shipping industry to reach net-zero emissions by or around 2050. The strategy also identifies checkpoints to track progress along the way.[52]
The IMO has implemented a tiered approach to reducing NOx emissions for new-built ships. The three tiers specify NOx restrictions for ships built after certain dates, with more stringent restrictions for newer ships. Tier III requires up to an 80% reduction in NOx emissions for all ships constructed after January 1, 2016, compared to Tier I.[53]
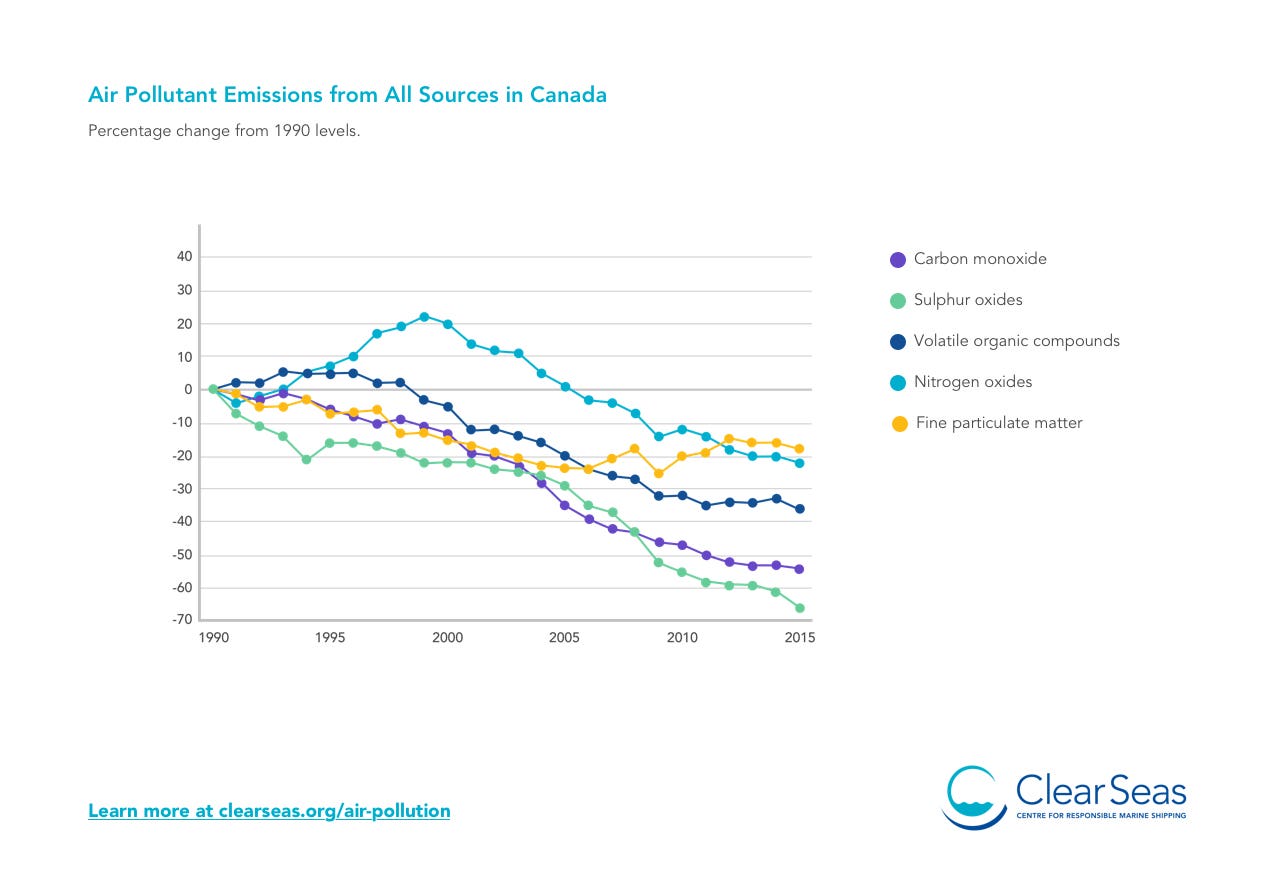
Regulations have positively impacted air quality in Canada with the majority of air pollutants decreasing significantly since 1990.[54]
Air Pollutant Emissions from All Sources in Canada
Percentage change from 1990 levels.

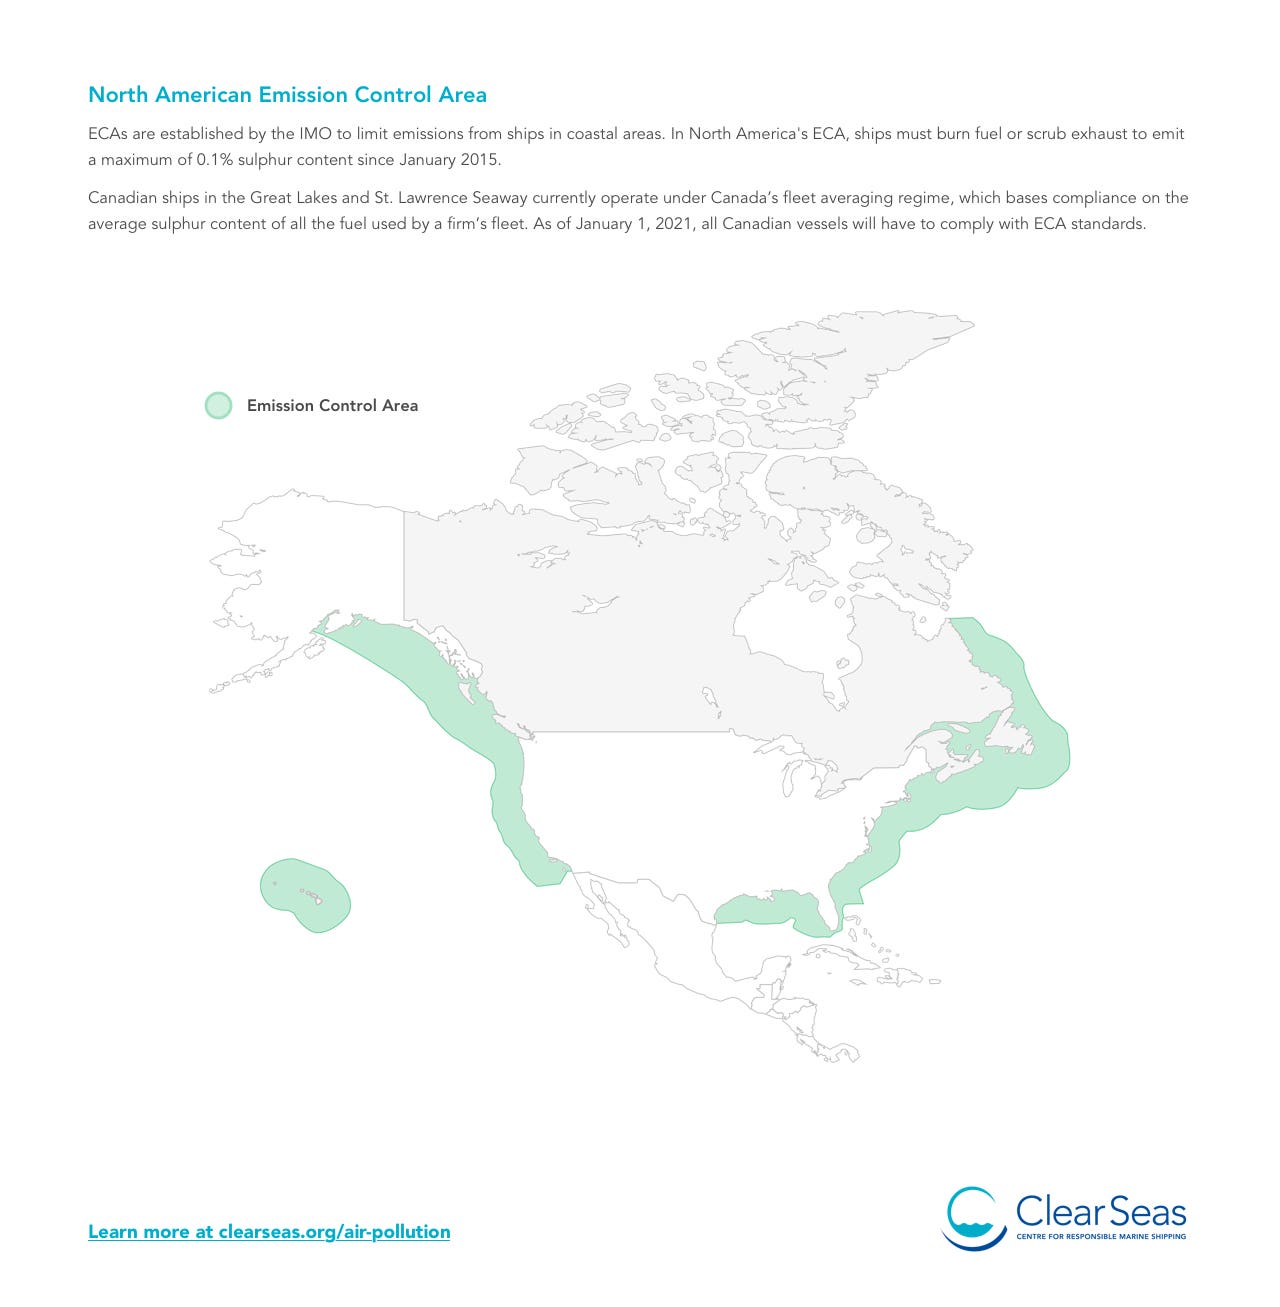
Emission Control Areas
In 2012, the IMO introduced emission control areas (ECAs) to minimize NOx, SOx and particulate matter in designated areas by implementing ship emission caps.
Canada’s Atlantic and Pacific coastal waters below the 60th parallel and out to 200 nautical miles are protected in the North American ECA.
By 2020, as a result of these standards, emissions from ships in the entire North American ECA were reduced by:[56]
NOx
36%
SOx
78%
Particulate Matter
36%
North American Emission Control Area
ECAs are established by the IMO to limit emissions from ships in coastal areas. In North America’s ECA, ships must burn fuel or scrub exhaust to emit a maximum of 0.1% sulphur content since January 2015.
Canadian ships in the Great Lakes and St. Lawrence Seaway are also required to comply with ECA standards.[57]
An unintended consequence of limiting sulphur content in fuel has been changes in ship routing and speed to reduce fuel costs – low sulphur fuel is both more expensive and has a higher carbon emission factor than heavy fuel oil[58] – which has increased GHG emissions as ships travel further overall to minimize time spent in ECAs.[59]

The estimated health benefits to Canadians by 2020 from reduced air pollution from ships operating in the North American ECA include:[44]
75%
reduction in asthma symptom days
66%
reduction in hospital admissions
55%
reduction in mortalities
49%
reduction in child acute bronchitis episodes
In Canada, the North American ECA is expected to result in:[44]
$1B
(billion) per year in net health benefits
96%
reduction of SOx and associated particulate matter emissions as of January 2015
80%
reduction of NOx emissions from newly built ships as of January 2016
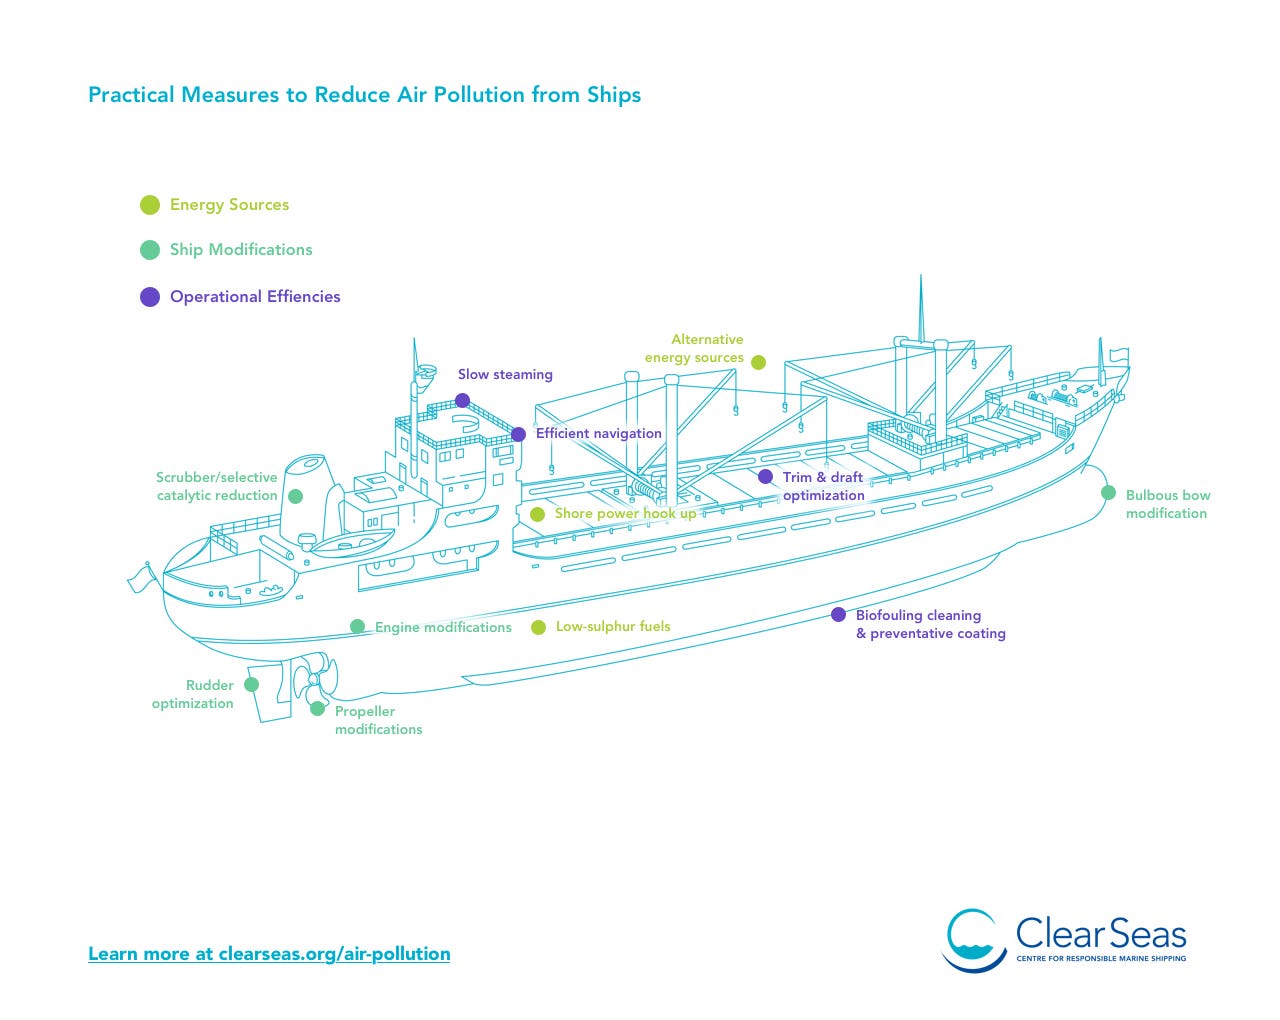
Practical Measures
To reduce air pollution from marine shipping, vessel operators and port facilities are implementing practical measures including alternative energy sources, modifications to ship components and operational efficiencies.[64]
Practical Measures to Reduce Air Pollution from Ships

Energy sources
Shore power is the process of providing electrical power from the shore to a ship while at a berth to shut off the ship’s auxiliary engines. Shore power reduces SOx, NOx and particulate matter emissions by 88% or more while in port and also reduces GHG emissions.[64]
To reduce SOx emissions ships can switch to a low-sulphur fuel or alternative fuel that has the added benefit of reducing particulate matter emissions. As of January 2020, the IMO reduced the permitted sulphur exhaust limit for all marine fuel from 3.5% to 0.5% outside ECAs.
- Marine diesel oil (MDO) – A heavy gas oil used primarily for marine purposes, this fuel can be produced with varying sulphur content.[65]
- Liquefied natural gas (LNG) – Liquefaction removes water, oxygen, carbon dioxide and sulphur compounds from the natural gas for a fuel of mostly methane with some other hydrocarbons and nitrogen.[66] This fuel produces lifecycle GHG emissions comparable to or sometimes higher than conventional marine fuels.[67][68]
- Methanol – Liquid at room temperature, methanol is easier to store and distribute than LNG, but it increases lifecycle GHG emissions by 12-15% compared to conventional marine fuels.[69]
Ongoing experiments are testing wind and solar power, batteries, biofuels and hydrogen fuel cells to power ships. These technologies are being applied for coastal transport, but are not yet viable for ocean-going commercial ships.[70]
Ship Modifications
- Exhaust gas cleaning systems or scrubbers mix exhaust with caustic soda or seawater, removing up to 99% of SOx and 98% of particulate matter from high-sulphur fuel.[71] After the global sulphur cap was implemented in 2020, the IMO reported 5.2% of vessels worldwide were approved to use scrubbers as an equivalent method to compliant fuels.[72]
- Selective catalytic reduction treats exhaust before release to reduce NOx emissions by 95%.[73]
- Humid air motor adds water vapour to the engine combustion chamber to reduce NOx emissions by 70%.[74]
- Internal engine modifications – adding water, recirculating exhaust gas, cooling water temperatures, or modifying overlap timing or intake valve closing – can reduce NOx emissions by nearly 100%.[75]
- Gas-fuelled engines can use LNG or methanol as fuel to reduce NOx emissions by up to 90% and SOx and particulate matter by 95% to 100% when compared to HFO.[76]
- IMO introduced the Energy Efficiency Design Index in 2011 to provide minimum energy efficiency standards for new ships.
- The IMO’s Ship Energy Efficiency Management Plan has been adopted for all ships to monitor Energy Efficiency Operational Indicators and assist ship operators in evaluating fleet CO2 emissions.[77]
- Areas of ship design that increase energy efficiency include the shape of the hull, propeller and rudder. Optimizing the hull shape and vessel superstructure is estimated to reduce fuel consumption by 15% for all types of vessels of over 5,000 gross tonnes.[78]
- Many vessel modifications can be applied to existing ships through retrofits though implementation is limited by the cost and time required.[79]
Operational Efficiencies
Speed reduction effectively reduces fuel consumption and therefore air pollutants. A speed reduction of 5% in open-ocean conditions is associated with reported fuel savings of approximately 13% for bulk carriers or tankers and 16%-19% for container ships. However, concerns go beyond increased travel time as ships may be operating outside of intended design parameters, potentially affecting the function of the engines and propellers and consumption of lubrication oil.[80]
Live organisms ranging from algae and microbes to sea stars and mussels can attach themselves to ships’ hulls, propellers and other underwater components in a process known as biofouling. This biological layer increases a ship’s resistance in water, increasing the fuel required to go an equivalent distance when compared to a clean ship. Research has estimated, depending on the thickness of the slime, a ship’s fuel consumption increases by 18% to 38%.[81] Regular hull cleanings, either in-water or in dry dock, contribute to operating efficiency. Anti-fouling coatings can discourage build-up and reduce the frequency of hull cleanings.
Cargo distribution can influence the amount of resistance during a voyage. Ship operators can apply software to optimize cargo loading and increase fuel efficiency by 0.5% to 5%, depending on vessel type.[82]
Ship operators can navigate more economically by navigating to avoid sharp load increases on the engine and incorporating tide and current conditions to reduce propulsion demand through route optimization.[83]
Initiatives Underway
- Shore Power Technology for Ports contribution program is providing up to $27.2 million to Canadian port authorities, terminal operators and ferry operators to support the deployment of marine shore power technology. Seven projects have been completed to date, five in British Columbia and one each in Nova Scotia and Quebec. Shore power technology reduces ship owners’ fuel costs and increases the competitiveness of Canadian ports.
- Green Shipping Corridor program with investment from Transport Canada of $165.4 million over seven years starting in 2023-2024 to fund research and development to advance the use of alternative fuels and new technologies to further reduce GHG emissions.
- Marine Emissions Inventory Tool (MEIT) was developed in 2010 as an activity-based emissions inventory for all vessels operating in Canadian waters. MEIT was recently revised with updated activity data and emissions factors. MEIT is used by government to assess changes in marine emissions and fuel consumption due to changes in regulations and other initiatives to reduce air pollution. You can access MEIT here.
- Demonstrated quantitative GHG emissions reductions by its ship owners through a voluntary reporting initiative; results show an average annual reduction of 1.4% between 2016 and the baseline (some as early as 2008).
- Revised performance indicator for GHG emissions in 2022 so that ship owners must demonstrably reduce their carbon emissions by 2.4% on average yearly to achieve the top level of accreditation.
- Separate performance indicators reduce SOx and particulate matter emissions (influenced by fuel quality) and NOx emissions (influenced by engine design).
- Manages the Port Emissions Inventory Tool made available by Transport Canada to allow ports to monitor GHG and air pollutants.

- Industry-led initiative launched in 2021 dedicated to accelerating the transition to a zero-emissions shipping industry in British Columbia.
- Launched a pilot project program called Operation Flagship, with the purpose of helping ship owners, operators, ports and terminals to source innovative and sustainable solutions, suited to their operating profile, to reduce GHG emissions.
- Co-founding Green Marine member, active since 2008 with an established GHG reduction target of 25% by 2025.
- Fleet now incorporates seven new vessels that are 40% more fuel efficient than previous ships, and seven vessels retrofitted with closed-loop exhaust gas scrubbers to remove 98% of SOx emissions and 43% of particulate matter from combusted fuel.

- Co-founding Green Marine member, active since 2007 with an established GHG reduction target of 35% by 2030 (from 2005 levels).
- In 2017, reduced GHG emissions per tonne-nautical mile by 5.6% (equivalent to 17,000 fewer cars driven for one year) and SOx emissions by 4.5% (equivalent to 114 million tonnes of sulphur).
- Launched the first two Canadian-flagged duel-fuel tanker vessels in 2016 that can be powered by LNG, MDO or HFO. The vessels are double-hulled with Polar 7 certification for Arctic navigation and have “Cleanship Super” and “Green Passport” sustainability certifications.
- The Port of Halifax was the first port in Atlantic Canada to implement shore power. Completed in 2013, the project was part of a $10 million cooperative initiative between the Government of Canada, the Province of Nova Scotia and the Halifax Port Authority. The installation is expected to improve air quality by decreasing engine idling by 7%, an amount representative of approximately 123,000 litres of fuel and 370,000 kg of GHG and air pollutant emissions.

- In 2017, the Alexandra Pier Shore Power Project was completed at a cost of $11 million, funded by the Government of Canada, the Province of Quebec, and the Montreal Port Authority. Annual GHG reductions are estimated at approximately 2,800 tonnes, equivalent to removing 700 trucks from the road.
- In May 2017, the Port of Montreal began providing dockside liquefied natural gas (LNG) refuelling commercial vessels by truck, completing 145 LNG refuelings between 2017 and 2021.
- Since 2007, the Port of Montreal has reduced the amount of GHGs emitted as a result of port operations by 33%, for a total of 3,098 tonnes of CO2e in 2022.
- In 2015 the Quebec Port Authority installed air quality monitoring equipment on port property and in the community to support the Port’s monitoring and pollution reduction efforts. View current data here.
- The EcoCargo program, introduced in 2022, offers discounts of up to 30% on harbour dues to shipowners who receive an A rating from RightShip, a GHG rating system which evaluates the relative efficiency of vessels and compares a ship’s CO2 emissions relative to peer vessels of a similar size and type.
- With $22.5 million in assistance from the Government of Canada, the Port of Québec is taking a key step towards the electrification of three cruise docks and two cargo docks. This $55 million project, part of Vision 2035, aims to reduce GHGs by 40% by 2035 and by 50% for cruise ships by 2030. By connecting ships to land-based electricity, the Port will reduce combustion emissions by up to 90%.
- Conducts an annual inventory of air pollution and GHG from port and terminal activities using the Port Emission Inventory Tool to prioritize ways to reduce emissions. Inventory results indicate marine vessels are the largest contributor to port emissions. Also conducts ongoing ambient air quality monitoring at Westview and Fairview Terminals to help understand air quality in the region.
- Designed Fairview Container terminal with shore power capability.
- Implemented the Green Wave Program in 2013 to provide reduced harbour dues for ships with strong environmental performance, such as using cleaner fuels.
- The EcoAction Program, launched in 2007, promotes emission reduction measures that exceed the current North American ECA requirements while vessels are operating within the Port’s jurisdiction by offering discounted harbour dues to vessels that have implemented emission reduction measures while at anchor and at berth.
- In 2009, the Port of Vancouver became the first in Canada and third in the world to offer shore power for ships. The port currently has three shore power connection points that have reduced air pollutants by 524 tonnes and GHG by 18,264 tonnes from cruise ships and container vessels.
About Clear Seas
Clear Seas is a Canadian not-for-profit organization that provides independent fact-based information to enable governments, industry, and the public to make informed decisions on marine shipping issues. We work to build awareness and trust so that all people can feel a part of the marine sector. Our vision is a sustainable marine shipping sector that is safe, vibrant, and inclusive, both now and for future generations.
As an independent research centre, Clear Seas operates at arm’s length from our funders. Our research agenda is defined internally in response to current issues, reviewed by our research advisory committee, and approved by our board of directors.
Our board of directors is composed of mariners, scientists, community leaders, engineers and industry executives with decades of experience investigating human, environmental and economic issues related to our oceans, coastlines and waterways.
Our reports and findings are available to the public at clearseas.org.
Health Impacts from Air Pollution from All Sources
Poor air quality is linked to health issues such as asthma, respiratory and cardiovascular disease, and premature death.[3] According to the World Health Organization, air pollution is the greatest environmental health risk to people as it triggers a range of health problems. In 2022, approximately 6.5 million deaths worldwide resulted from ambient air pollution.[4] In Canada, approximately 15,300 premature deaths each year can be linked to air pollution.[5]
As of 2016, worldwide ambient air pollution accounts for:
- 16% of lung disease deaths
- 43% of chronic obstructive pulmonary disease (COPD) deaths
- 17% of heart disease and stroke deaths
- 26% of respiratory infection deaths[6]
Climate Change
- In force since November 2016, the Paris Agreement aims to strengthen the global response to climate change by limiting global temperature increases this century to 1.5℃ above pre-industrial levels.[15] To achieve this, global GHG emissions must be reduced by 45% below 2010 levels by 2030 and reach net zero by or around 2050.[16]
- Emission regulations for the shipping industry are dictated by the International Maritime Organization (IMO) independent of the Paris Agreement.[17] If all other sources of GHG are limited according to the Paris Agreement but shipping CO2 emissions are not, the industry could contribute up to 17% of the world’s total air emissions by 2050.[18]
- With current policies in place, the average global temperature is projected to rise by at least 2.7℃ by 2100 and the temperature in Canada is projected to rise by 6.3℃ due to Arctic amplification, with devastating effects on people and the environment, particularly in the Arctic.[19]
Air Pollution in MARPOL Annex VI
The regulations for the Prevention of Air Pollution from Ships (Annex VI) seek to control airborne emissions from ships (SOx, NOx, ozone depleting substances, and VOCs) and their contribution to local and global air pollution, human health issues and environmental problems.[49]
- The 2008 revisions to Annex VI introduced progressive reductions for global emissions of SOx, NOx and particulate matter and also specific emission control areas (ECAs) in the Baltic Sea, the North Sea and coastal North America. The revisions are expected to have a beneficial impact on human health and the atmospheric environment, particularly in coastal areas.
- New amendments to Annex VI in 2022 require improvements in operational efficiency through the Energy Efficiency Existing Ship Index (EEXI) and reporting on an annual operational carbon intensity indicator (CII). This CII rating indicates the amount of GHG emissions produced to transport cargo for the distance travelled.[50]
North American Emission Control Area
- Canada and the United States first agreed to pursue a North American ECA in 2006.
- In 2010, the IMO approved the joint application for the North American ECA and it came into force internationally in August 2012.
- As of 2015, ships operating in an ECA were required to use fuel with less than 0.1% sulphur. Outside of ECAs, ships are permitted to use fuels with sulphur content up to 0.5% as mandated by the global cap on sulphur in fuel, which came into effect in January 2020. Based on satellite tracking of ship emission clouds, sulphur emissions from ships dropped by more than 50% starting in 2020.
Sources & Citations
- United Nations Conference on Trade and Development. (2015). Review of Maritime Transport. p. 5.
- Council of Canadian Academies. (2017). The Value of Commercial Marine Shipping to Canada. Clear Seas Centre for Responsible Marine Shipping. p. 38, 70.
- Government of Canada. (2023). Health Effects of Air Pollution. Environment and Climate Change Canada.
- Fuller, R. et al. (2022). Pollution and Health: A progress update. The Lancet. Vol. 6, Iss. 6, E535-E547.
- Government of Canada. (2023). Health Effects of Air Pollution. Environment and Climate Change Canada.
- World Health Organization. (2018). Ambient Air Pollution.
- Research and Traffic Group. (2013). Environmental and Social Impacts of Marine Transport in the Great Lakes-St. Lawrence Seaway Region (Executive Summary). p. 6.
- Council of Canadian Academies. (2017). The Value of Commercial Marine Shipping to Canada. Clear Seas Centre for Responsible Marine Shipping. p. xvi, 43, 90.
- International Maritime Organization. (2020). Fourth IMO Greenhouse Gas Study 2020. p. 1-3.
- International Maritime Organization. (2020). Fourth IMO Greenhouse Gas Study 2020. p. 1-3.
- World Health Organization. (2018). Ambient Air Pollution: Health impacts. Health risks.
- International Maritime Organization. (2020). Fourth IMO Greenhouse Gas Study 2020. p. 1-3.
- Intergovernmental Panel on Climate Change. (2021). Sixth Assessment Report: Working Group 1: The Physical Science Basis. Figure 6.3.
- Government of Canada. (2020). Global greenhouse gas emissions. World Research Institute data.
- United Nations Climate Change. (2018). The Paris Agreement.
- United Nations Climate Action (2023). For a livable climate: Net-zero commitments must be backed by credible action. Net-Zero Coalition.
- Comer, B. & Carvalho, F. (2023). IMO’s newly revised GHG strategy: What It means for shipping and the Paris Agreement. International Council on Clean Transportation.
- European Parliament: Economy and Scientific Policy. (2018). IMO’s Challenges on the Route to Decarbonising International Shipping: Key issues at stake at the 72nd session of the IMO MEPC. Briefing: Environment, Public Health and Food Safety. p. 2.
- Bush, E. and Lemmen, D.S., editors. (2019). Canada’s Changing Climate Report. Government of Canada.
- Government of Canada. (2023). Climate Change Science, Research and Data. Climate Trends and Variability.
- World Health Organization. (2022). Ambient (Outdoor) Air Quality and Health. Nitrogen dioxide.
- Government of Canada. (2022). Health Impacts of Traffic-Related Air Pollution in Canada. Health Canada. pg 22.
- United States Environmental Protection Agency. (1999). Technical Bulletin: Nitrogen oxides (NOx), why and how they are controlled. Clean Air Technology Center. p. 7.
- World Health Organization. (2022). Ambient (Outdoor) Air Quality and Health. Sulphur dioxide.
- World Health Organization. (2022). Ambient (Outdoor) Air Quality and Health. Sulphur dioxide.
- Fuller, R. et al. (2022). Pollution and Health: A progress update. The Lancet. Vol. 6, Iss. 6, E535-E547.
- Government of Canada. (2023). Health Effects of Air Pollution. Health Canada.
- Cho, R. (2016). The Damaging Effects of Black Carbon. State of the Planet, Earth Institute, Columbia University.
- Clear Seas. (2022). Black Carbon in the Arctic: What you need to know.
- Hansen, J. and Nazarenko, L. (2004). Soot Climate Forcing via Snow and Ice Albedos. Proceedings of the National Academy of Sciences of the United States of America. 101 (2). p. 423-428.
- Government of Canada. (2013). Air Pollution: Human health costs. Environment and Climate Change Canada.
- United Nations Climate Change. (2022). National Inventory Submissions 2022.
- Government of Canada (2021). Aquaculture Production Quantities and Values. Fisheries and Oceans Canada.
- Government of Canada. (2022). Corals and Sponges of the Maritimes. Fisheries and Oceans Canada.
- Fisheries and Oceans Canada (2009). British Columbian Corals. Electronic Atlas of the Wildlife of British Columbia.
- United States Environmental Protection Agency. (1999). Technical Bulletin: Nitrogen oxides (NOx), why and how they are controlled. Clean Air Technology Center. p. 7.
- Government of Canada. (2018). Acid Rain: Causes and effects. Environment and Climate Change Canada.
- Anastasopolos, A. T., et al. (2021). Air quality in Canadian port cities after regulation of low-sulphur marine fuel in the North American Emissions Control Area. Science of the Total Environment. 791.
- Government of Canada. (2018). Acid Rain: Causes and effects. Environment and Climate Change Canada.
- Clear Seas. (2022). Black Carbon in the Arctic: What you need to know.
- Arnold, S.R. et al. (2016). Arctic Air Pollution: Challenges and opportunities for the next decade. Elementa: Science of the Anthropocene. Vol. 4 (104).
- Protection of the Arctic Marine Environment. (2021). Heavy Fuel Oil Use by Ships in the Arctic 2019. Arctic Council SAO Meeting, 16-18 March, Reykjavik, Iceland.
- Comer, B. et al. (2017). Prevalence of Heavy Fuel Oil and Black Carbon in Arctic Shipping, 2015 to 2025. The International Council on Clean Transportation. p. 22.
- Canada and the Marshall Islands. (2018). Comments on Document MEPC 72/11/1 on Measures to Reduce Risks of Use and Carriage of Heavy Fuel Oil as Fuel by Ships in Arctic Waters. Considerations.
- Lloyd’s Register Group Limited. (2023). Amendments to MARPOL Annex I – Prohibition on the use and carriage of heavy fuel oil as fuels in Arctic waters comes into effect in 2024. Lloyd’s Register Class News 08/2023.
- Government of Canada. (2021). International Maritime Organization Consideration of a Proposed Ban on Heavy Fuel Oil in the Arctic. Transport Canada.
- International Maritime Organization. (2011). Antarctic Fuel Oil Ban and North American ECA MARPOL Amendments Enter into Force on 1 August 2011. Use or carriage of oil in Antarctic Area.
- Environment Canada. (2007). Regulatory Framework for Air Emissions. p. 30-31.
- International Maritime Organization. (2023). Index of MEPC Resolutions and Guidelines related to MARPOL Annex VI. Amendments to MARPOL Annex VI and the NOx Technical Code.
- International Maritime Organization. (2018). Marine Environment Protection Committee (MEPC), 72nd session, 9-13 April 2018. Greenhouse gas emissions initial strategy adopted.
- International Maritime Organization. (2023). 2023 IMO Strategy on Reduction of GHG Emissions from Ships.
- International Maritime Organization. (2023). Nitrogen Oxides (NOx) – Regulation 13.
- Government of Canada. (2023). Air Pollutant Emissions. Environment and Climate Change Canada.
- Government of Canada. (2023). Air Pollutant Emissions. Environment and Climate Change Canada.
- Government of Canada. (2023). Air Pollutant Emissions. Environment and Climate Change Canada.
- Transport Canada. (2013). New Regulations for Vessel Air Emissions: Fleet averaging plans and annual reporting – SSB No.: 03/2013. Ship Safety Bulletin.
- Jiang, R. and Zhao, L. (2022). Effects of IMO sulphur limits on the international shipping company’s operations: From a game theory perspective. Computers & Industrial Engineering, Vol 173, Nov 2022, 108707, ISSN 0360-8352.
- Clear Seas. (2022). Unintended Consequences – Identifying Conflict Between the Dual Objectives of Reducing Greenhouse Gas Emissions and Air Pollution from Marine Shipping. Presentation.
- United States Environmental Protection Agency. (2010). Designation of North American Emission Control Area to Reduce Emissions from Ships. Office of Transportation and Air Quality.
- DNV. (2023). Global Sulphur Cap 2020.
- Yuan, T. et al. (2022). Global reduction in ship-tracks from sulfur regulations for shipping fuel. Sci. Adv., 8 (29), eabn7988.
- Anastasopolos, A. T., et al. (2021). Air quality in Canadian port cities after regulation of low-sulphur marine fuel in the North American Emissions Control Area. Science of the Total Environment. 791.
- Winnes, H. et al. (2015). Reducing GHG Emissions from Ships in Port Areas. Research in Transportation Business & Management. Vol. 17. p. 73-82.
- Wang, H. et al. (2015). Costs and Benefits of Shore Power at the Port of Shenzhen. The International Council on Clean Transportation and Wilson Center. p. 12.
- Environment Canada. (1999). Marine Diesel Fuel Oil. Emergencies Science and Technology Division factsheet.
- Natural Resources Canada. (2018). Liquefied Natural Gas. What is LNG?
- Gilbert, P. et al. (2018). Assessment of Full Life-cycle Air Emissions of Alternative Shipping Fuels. Journal of Cleaner Production. Vol. 172. p. 855-866.
- Clear Seas. (2022). Investigating LNG as a Marine Fuel for Canada’s Arctic. Report.
- Gilbert, P. et al. (2018). Assessment of Full Life-cycle Air Emissions of Alternative Shipping Fuels. Journal of Cleaner Production. Vol. 172. p. 855-866.
- Cotorcea, A. et al. (2014). Present and Future of Renewable Energy Sources Onboard Ships. Case Study: Solar – Thermal Systems. Naval Academy Scientific Bulletin. Vol. XVII (1). p. 35-39.
- Exhaust Gas Cleaning Systems Association. (n.d.). What is an Exhaust Gas Cleaning System?
- International Maritime Organization. (2021). IMO2020 fuel oil sulphur limit – cleaner air, healthier planet. 28 January 2021.
- Komar, I. et al. (2007). Selective Catalytic Reduction as a Secondary Method to Remove NOx from Diesel Engine Exhaust Gas. IFAC Proceedings Volumes. Vol. 40(17). p. 305-309.
- Riom, E. et al. (2002). Reducing NOx Emissions Using the Humid Air Motor Concept. MTZ worldwide. Vol 63(5). p. 10.
- Lamas, M.I. et al. (2013). Internal Modifications to Reduce Pollutant Emissions from Marine Engines: A numerical approach. International Journal of Naval Architecture and Ocean Engineering. Vol. 5(4). p. 493-501.
- Æsøy, V. and Stenersen, D. (2013). Low Emission LNG Fuelled Ships for Environmental Friendly Operations in Arctic Areas. ASME 2013 32nd International Conference on Ocean, Offshore and Arctic Engineering. Conference paper.
- International Maritime Organization. (2009). Guidelines for Voluntary Use of the Ship Energy Efficiency Operational Indicator (EEOI). Marine Environment Protection Committee 59th session.
- V. Delta Ltd. (2015). REFRESH (Green Retrofitting of Existing Ships). CORDIS Community Research and Development Information Service.
- Hochkirch, K. and Bertram, V. (2010). Engineering Options for More Fuel Efficient Ships. GreenTech 2010. Conference paper.
- Demirel, Y.K. et al. (2016). Predicting the Effect of Biofouling on Ship Resistance Using CFD. Applied Ocean Research. Vol. 62. p. 100-118.
- GloMEEP. (n.d.). Trim and Draft Optimization. Energy Efficiency Technologies Information Portal.