This volume concentrates on vessel traffic and associated oil movements along the west coast of Canada, particularly for the years 2011-2012.
Executive Summary
Clear Seas is an independent, not-for-profit organization that provides impartial and evidence-based research to inform the public and policy makers about marine shipping in Canada.
We are providing this digest of the BC Ministry of Environment’s West Coast Spill Response Study, Volume 2: Vessel Traffic Study
This short digest is not meant to be inclusive of all the Review’s commentary and/or recommendations, nor are the items mentioned necessarily in the same order as the original report.
Message from the Executive Director
As shipping volumes increase on Canada’s west coast, and with further major marine transportation projects anticipated for BC ports, the government of British Columbia has a vested interest in better understanding the risks particularly associated with increased ship-based oil movements. To that end the British Columbia Ministry of Environment commissioned Nuka Research to conduct a three-volume study to provide an assessment of the current oil spill prevention and response regime on the west coast. The study was completed in 2013.
For marine oil spill prevention, preparedness, response, and recovery – and the provincial government’s aspiration for a world-leading system – it is important to note that it relies on initiatives that are largely beyond provincial jurisdiction – and on a network of international, federal, provincial, and local regulatory and response authorities. As such the recommendations for BC mentioned in the report must be considered in the context of these other jurisdictional realities.
The purpose of Volume 2 of the West Coast Spill Response Study is to provide the BC government with an analysis of vessel traffic and associated oil movements along the west coast of Canada. In so doing it analyzes vessel traffic movements along the coast of British Columbia for the 2011-2012 calendar years, estimates the quantities of petroleum transported as cargo and fuel, and forecasts potential growth or changes to vessel traffic density and movements over the next 15 years.
This digest covers some of the major observations of this volume.
This volume concentrates on vessel traffic and associated oil movements along the west coast of Canada, particularly for the years 2011-2012. It also estimates the quantities of petroleum transported as cargo and fuel, and forecasts potential growth or changes to vessel traffic density and movements over the next 15 years
Operating Environment
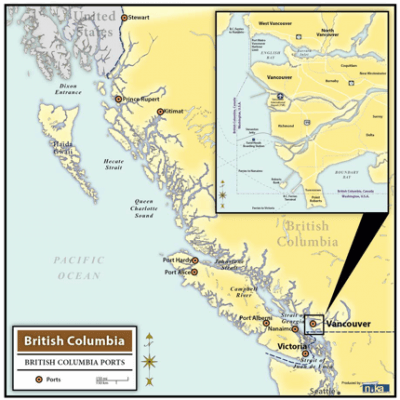
BC has over 27,000km of coastline, including the shorelines of the approximately 6,000 islands along its coast. Along both mainland and island coasts, the shorelines are indented by numerous inlets, bays, and fjords.
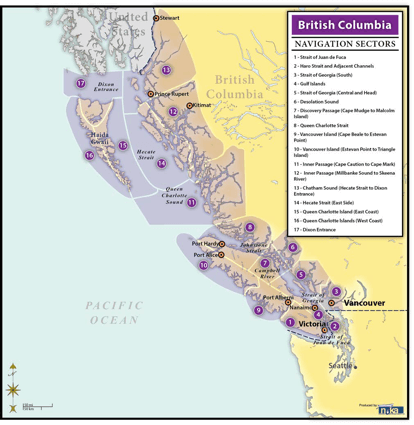
As the following two maps indicate, vessels operate in a number of complex navigation sectors and out of three levels of ports – Port Authorities, regional/local ports, and remote ports.
The analysis focuses mainly on vessels carrying oil as cargo (tankers and tank barges) regardless of size, and large vessels (>400 Gross Tonnes [GT])[1] carrying oil as fuel, including cargo vessels, ferries, fishing vessels, government ships and cruise ships.
Navigation Routes and Vessel Activity
British Columbia ports and waterways provide a major shipping corridor between Asia and North America. Vessel Activity on Canada’s west coast includes both international shipping traffic and local transits between BC ports.
There are areas of the BC coast where laden oil tankers are restricted from operating. Through a Transport Canada policy, tankers over 40,000 Deadweight Tonnes (DWT)[2] [3] are prevented from using the southern portion of the Inner Passage, specifically the Johnstone Strait and Discovery Passage. Instead, they are directed to the outside route for north/south transits.
Laden oil tankers traveling along the BC coast but not calling on a Canadian port generally adhere to a voluntary tanker exclusion zone that keeps them 50 nautical miles [4] or farther offshore.
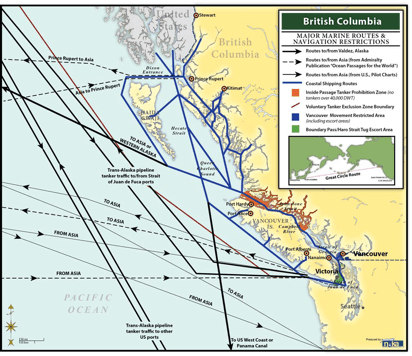
In the Port of Vancouver, there are movement restrictions through the Second Narrows including operational periods that restrict certain vessels to transits during slack tide, navigational channel clearances, speed restrictions, visibility limits, communications procedures, escort tugs, pilotage, traffic schemes, and other requirements.
The following figure shows major marine routes along with areas of restricted navigation.
Traffic and Fuel Volume Analysis Methodology
Automatic Identification System (AIS)[5] data was used as the primary source for this analysis. AIS provides a set of data including a date and timestamp, the vessel’s name and specifications, the type of cargo carried, the navigational status (underway, anchored, etc.), the vessel speed and heading, and its intended destination.
But because the raw AIS data did not provide sufficient information about the vessel characteristics for this study, ship registry data, based on each vessel’s Maritime Mobile Security Identity (MMSI) number was also used, as well as looking up individual vessels through online databases.
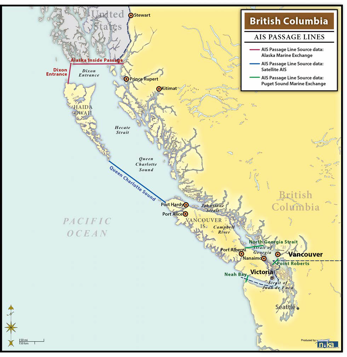
Passage lines were used as a method to compile and compare vessel movements through different waterways. For this analysis, six passage lines that essentially outline the coast (Dixon Entrance, Alaska Inside Passage, Neah Bay, North Georgia Strait, Point Roberts, Queen Charlotte Sound) were used to capture vessel traffic movements throughout the region. To estimate the aggregated volume and type of vessel traffic operating along the BC coastline, a two-year historical dataset of AIS vessel passage lines (2011-2012) were compiled and analyzed.
When it came to predicting primary and secondary fuel volumes and oil cargo, gross tonnage was the best predictor of the amount of petroleum likely to be on board (primary and secondary fuel capacity[6], plus oil cargo capacity for tankers). Overall, this method worked well to predict tanker oil cargo volume, and also very well for predicting primary fuel capacity. Otherwise averages from known vessels of the same vessel type of similar size were used to develop estimates of fuel capacity.
Vessel Traffic Analysis
The following table illustrates total vessel transits by passage line, vessel type, and year (2011 and 2012).
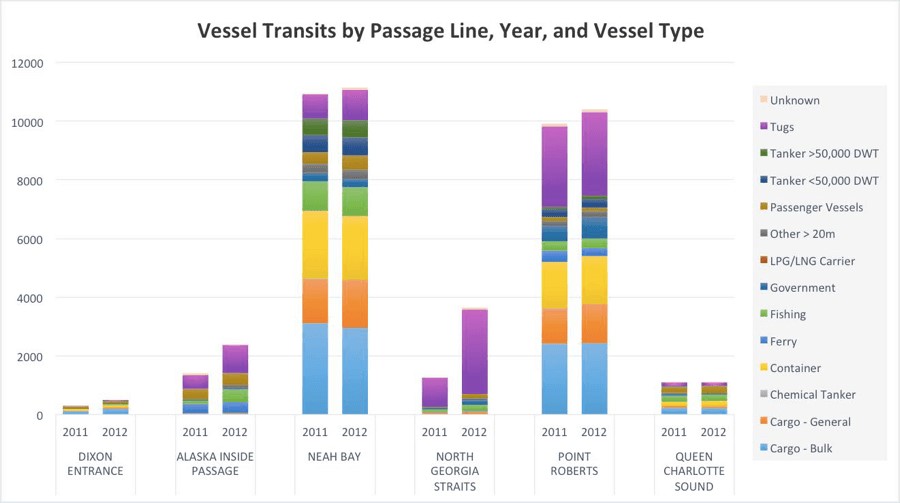
A total of 54,117 vessel transits were recorded for the chosen passage lines during the two-year period. These include multiple trips by the same vessel, which is particularly common for ferries and commercial vessels with established trading routes and schedules.
The vast majority of vessel transits (78%) occurred in southern BC through the Strait of Juan de Fuca at the Neah Bay and Point Roberts passage lines. This percentage is somewhat shaped by the fact that there is a high percentage of overlap between these two lines. About 13% of the vessel transits occurred in central BC through Queen Charlotte Sound or North Georgia Strait.
From 2011 to 2012, the volume of traffic across all passage lines increased by approximately 17%[7]. The increases in transits in 2012 compared to 2011 were most dramatic for Dixon Entrance, Alaska Inside Passage, and North Georgia Strait (though the latter may be related to improved AIS data collection, and not necessarily to an actual increase in transits).
The distinction between the total numbers of transits made in a given year as opposed to crossings made by unique vessels is an important one. The number of unique vessels is relevant to spill prevention and safety measures such as the number of vessel inspections that should be conducted. When compared to total transits, it is also an indicator of the proportion of the transits made by vessels whose captain and crew are likely to be familiar with the area (though the use of marine pilots mitigates potential problems caused by unfamiliarity with the area). The number of unique vessels crossing each passage line followed the same general trend as total crossings, with the highest number of unique vessels crossing Neah Bay, followed by Point Roberts, for both years.
Cargo vessels, container ships, and tugs had the highest volume of transits.
Vessel traffic movements for cargo vessels were divided into three categories: general cargo ships, bulk cargo ships, and container ships. General cargo carriers transport non-containerized cargo such as wood, construction materials, and vehicles. Bulk carriers transport cargo such as coal, cement or wood products in bulk. Containerships carry all of their cargo in intermodal containers. Both cargo ships and container vessels have the potential to carry significant quantities of fuel oil.
Estimated Petroleum Volumes
Petroleum is carried by ships both as cargo and as fuel (bunker) for the vessel.
It is also carried as cargo on barges.
Persistent oils are crude oils and heavy or intermediate fuel oils. They are carried as cargo primarily by large (>50,000 GT) crude oil tankers and as fuel oil for large cargo and container ships. Non-persistent fuels are refined products such as home heating oil, gasoline, diesel fuel, and jet fuel. They are carried as cargo primarily by smaller tankers and barges. Non-persistent fuels are also carried as secondary fuel sources on large vessels that are propelled by persistent oils, and as primary fuel sources for smaller and newer vessels, including passenger ships, fishing vessels, and tugs.
The report estimated that about 110 million m3 (~94 million tonnes[8]) of petroleum per year moved across the six passage lines used for this study in vessels other than tank barges. The best estimate of oil moved by tank barge was 48 million m3 (41 million tonnes) per year, 95 percent of which would be non-persistent oil.
Of the 110 million m3 (~94 million tonnes) of petroleum per year moved across the six passage lines of this study, persistent oil carried as bunker fuel (primarily in cargo ships) accounted for about 42 million m3 (~36 million tonnes) per year. About 38 million m3 (~32.6 million tonnes) per year was persistent oil cargo, primarily Alaska North Slope crude oil being shipped to the refineries in Washington. About 25 million m3 (~21.5 million tonnes) per year of non-persistent oil was carried as cargo in tank vessels. The remaining 5 million m3 (~4.3 million tonnes) were carried as fuel in a wide variety of vessels.
The following figure illustrates the relative portions of overall oil movement crossing each passage line (persistent and non-persistent oil moved as both fuel and cargo). Barge transportation is not included.
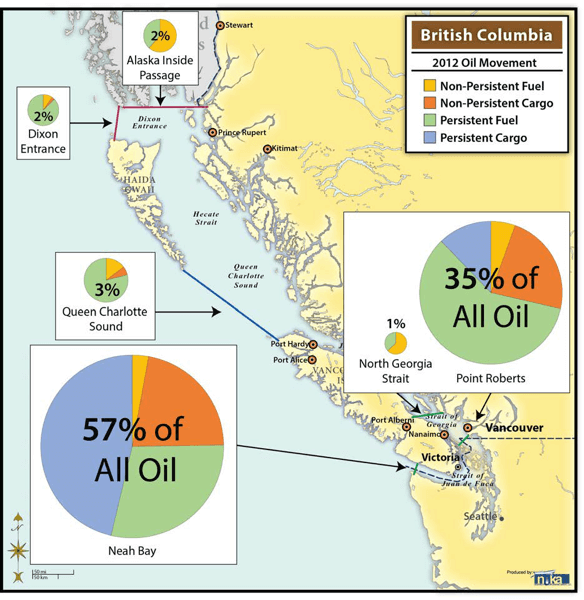
The Neah Bay passage line accounted for an estimated 57% of all oil moving across the passage lines by vessels other than tank barges (with persistent cargo, primarily Alaska North Slope crude oil, as the largest portion). This was followed by an estimated 35% moving across the Point Roberts passage line (with persistent fuel as the largest portion). The four low-volume passage lines account for 8% of the total.
Worst-case Spill Volumes
As a rough estimate, based on the vessel traffic recorded, the overall worst-case spill would be the loss of 210,000m3 (~180,200 tonnes) of crude oil from the largest tanker. This size spill could only occur on the outer coast or in the Strait of Juan de Fuca south of Point Roberts. The largest petroleum cargo volume of a vessel recorded in the Georgia Straits near Vancouver was 127,000 m3 (~109,000 tonnes of persistent oil in a crude tanker), and on the inside waters of northern and central BC it was 57,000 m3 (~49,000 tonnes of non-persistent oil in a product tanker). A spill from an Articulated Tug and Barge could exceed 25,000m3 (~21,500 tonnes) of non-persistent oil. A spill of persistent oil bunkers from a large cargo ship could exceed 12,000 m3 (~10,300 tonnes) in any area of the province.
Forecasted Vessel Activity
Projected changes to vessel activity, based on BC port development[9] include ten projects for the Port of Vancouver, five for Prince Rupert, eight for Kitimat, two for Stewart, and one for Port Alberni.
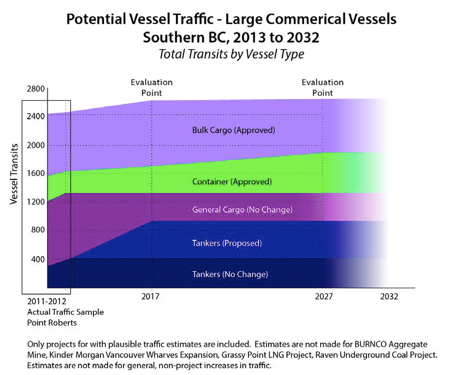
The following two figures represent potential vessel traffic with projects for the north (Ports of Prince Rupert, Stewart, and Kitimat) and south (Port of Vancouver) respectively.
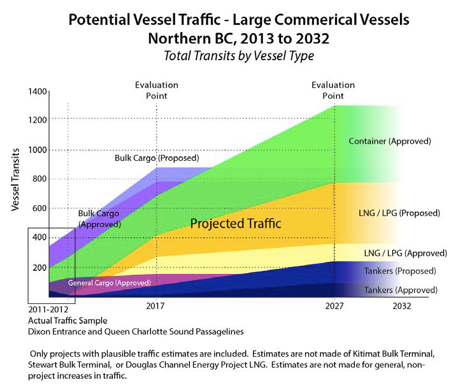
While overall vessel traffic is forecasted to remain much higher in the Vancouver area than farther north on the coast, the greatest changes could be seen based on potential traffic going in and out of Prince Rupert, Stewart, and Kitimat (depending on which projects go forward and which projects are proposed in the future which were not included here). Most of the increases forecasted for the northern coast are attributed to container ships, with a near-term increase in bulk cargo predicted as well as based on projects that are already underway.
The potential impacts of an increase in container vessels, many of which come from projects already approved at the time of writing[10], should not be discounted since they may carry up to 12,000 m3 (~10,300 tonnes) of their own fuel, which is approximately equal to the volume that federal law currently requires a response organization to be able to clean up.
Even if all the projects identified (for which vessel estimates were available or could be construed) went forward, the number of tankers transiting to and from northern ports would remain far lower than the number of tanker transits in the far south of BC; however, the percentage change that this represents would be significant: tanker traffic in the south could more than double, while in the north it could go from being negligible to being around 200 transits per year.
It is important to note that the rough projections do not include vessels passing along the BC coast without stopping at a Canadian port.
Forecasted vessel movements to and from US North Pacific ports suggested an increase in the movement of most types of marine cargo through the year 2030. Overall, the net projection was for an increase of 133 tanker transits per year from Alaska by 2030, although the percentage of these tankers that would transit through BC waters is uncertain.
The potential changes to vessel traffic have several implications for oil spill prevention and response. As traffic increases, areas that were previously at a relatively low risk of an oil spill may be at a higher risk. Traffic increases will also require resources to scale up or require an expansion of safety and spill prevention measures that are already in place, such as pilotage, vessel escorts, and inspections.
Changes may also include needing to ramp up preparations for a spill in the central or north coast areas; increased fees to the Western Canada Marine Response Corporation (WCMRC); the size of a spill to which responders are capable of responding; or other items that are addressed in Volume 3 of this study.
[1] Gross Tonnage (GTs) is a volumetric measurement of the enclosed space or internal volume in a ship. It is not directly related to the mass or weight of the ship. Gross Tonnage was defined by The International Convention on Tonnage Measurement of Ships, 1969, adopted by the International Maritime Organization, and is used to determine things such as a ship’s manning regulations, safety rules, registration fees, and port dues.
[2] Deadweight Tonnage (DWT) is a measure of how much mass a ship is carrying or can safely carry; it does not include the mass of the ship. DWT is the sum of the masses of the cargo, fuel, fresh water, ballast water, provisions, passengers, and crew.
[3] A ship of 40,000 DWT in size is classified within the “Handymax”, or in Canada, as the “Seawaymax” size (the largest size of vessel that can fit through the canal locks of the St. Lawrence Seaway).
[4] A nautical mile is a unit of measurement defined as 1852 meters (approximately 6,080 feet or 1.2 statute miles).
[5] AIS is an automated tracking system used on ships and by Vessel Traffic Services (VTS) for identifying and locating vessels by electronically exchanging data with other nearby ships and VTS stations.
[6] Primary fuels are used for vessel propulsion, and secondary fuels run ancillary systems.
[7] These numbers are not necessarily indicative of longer-term trends, as they portray only two years of data.
[8] For context, the Montreal Olympic stadium has a volume of 1.9 billion litres, equivalent to 1.7 million tonnes of oil. Thus, 94 million tonnes would fill Montreal’s Olympic stadium 55 times.
[9] Based on a review of projects that are currently proposed or approved, though the nature of the information available for each project varies widely, and new projects, not public at the time of the writing of this volume, could emerge at any time. Similarly, projects currently proposed may be changed or eliminated.
[10] See pages 65-75